Eight rule-based strategies (sleeves) buy the largest, most heavily traded stocks after a short, sharp dip. Money not in a trade sits in a spread-out reserve so it keeps earning. In rare market panics, a crash guard switches the whole portfolio to defense. The rules re-run daily on real closing prices and the results are published, so you can check the record before you pay.
Where the 26% comes from: a backtest (a simulation on past prices) over 2010–2025 at 2× exposure in calm months (every dollar of your own money controls two dollars of stock), and checked against the member strategy lab's own code. The +12.8% comes from the first half of 2026, with no leverage, on days the locked model had never seen. Members get the full interactive strategy lab and every validation test.
Data through 2026-10-23. The signals are recalculated every day after the U.S. market closes, skipping weekends and market holidays. The daily closing price is the official record.
Read this honestly: the 26% backtest is optimistic because it only counts the strategy versions that survived our testing. Plan on a high-teens yearly return (CAGR) in live trading at 2× exposure in calm months. The crash guard only holds a position that gains when the market falls during the months it is triggered, never permanently. Right now it is not triggered, so the portfolio is at its full calm-market size. For loss planning, use the −22.3% loss from the 2008 stress test, not the milder −16.5% worst decline (drawdown) in the backtest. The flagship changed on 2026-07-17: version 7 replaced the earlier 10-sleeve version, whose short paper record is archived separately, not mixed into v7's.
Backtest 2010–2025 · 2× exposure in calm months, halved by the crash guard in defensive months · log scale: equal steps up the axis are equal percentage gains
| Year end | Mereckis Labs v7 | QQQ | SPY | v7 deepest dip that year |
|---|---|---|---|---|
| 2010 | $1.28 | $1.20 | $1.15 | −10.7% |
| 2011 | $1.53 | $1.24 | $1.17 | −12.2% |
| 2012 | $1.63 | $1.47 | $1.36 | −12.7% |
| 2013 | $2.02 | $2.01 | $1.80 | −7.5% |
| 2014 | $2.15 | $2.39 | $2.04 | −11.9% |
| 2015 | $2.17 | $2.62 | $2.07 | −16.5% |
| 2016 | $2.77 | $2.80 | $2.31 | −12.8% |
| 2017 | $3.93 | $3.72 | $2.82 | −6.6% |
| 2018 | $4.44 | $3.71 | $2.69 | −13.6% |
| 2019 | $6.13 | $5.16 | $3.53 | −7.9% |
| 2020 | $9.74 | $7.66 | $4.17 | −12.8% |
| 2021 | $12.41 | $9.76 | $5.37 | −13.0% |
| 2022 | $13.25 | $6.58 | $4.40 | −13.7% |
| 2023 | $22.43 | $10.19 | $5.55 | −9.7% |
| 2024 | $27.03 | $12.79 | $6.93 | −9.5% |
| 2025 | $41.36 | $15.58 | $8.22 | −9.7% |
Real backtest data, not an illustration, checked against the member strategy lab's own code. This is the backtest at 2× exposure in calm months, and it is optimistic because only surviving versions are counted: plan on high-teens a year in live trading, not the headline. This version became the flagship because of how it behaves in crashes: in rare months when market swings spike, the guard moves into a defensive basket (including a position that gains when the market falls) and halves exposure, so a 2008-style stress test loses −22.3% and 2020 loses −6.8%. The first true out-of-sample test (first half of 2026, unseen data) returned +12.8% with no leverage and a 1.73 Sharpe ratio. A live paper record has been building since 2026-07-10.
These three behaviors held up on data the strategy had never seen. The headline return has not yet been tested on new data for long enough to count.
Eight sleeves buy the largest, most heavily traded stocks after a 2-day drop, as long as the stock is still above its 200-day average price, then sell when the price bounces back. Trades last about 6 days, with 0–2 orders a day. The eight are re-picked each January by their Sharpe ratio (return per unit of risk) over the previous 3 years, using only information available at the time, no peeking.
Once a month the guard checks two warning signs: a spike in volatility (the size of daily price swings) into the top 10% of history, or a 5-day market drop in the worst 10%. If either fires, the reserve moves into a crisis basket with a 30% position that gains when the market falls and total exposure is cut in half. In the backtest, that turns a 2008-style crash into −22.3% and the 2020 COVID crash into −6.8%.
Signals are recalculated daily on real prices and published after the close. Money not in a trade sits in a capped reserve, 25% each in silver, U.S. government bonds (treasuries), semiconductor stocks, and a low-volatility stock fund. Versions v1 to v7 each had to beat the last on tests set in advance, and 40+ rejected ideas are documented. When something fails a test, we say so.
This is paper trading only. The trades are simulated: no real money is at risk and no live orders are placed. The version 7 flagship's day-by-day record has been building since 2026-07-10. The earlier 10-sleeve version's record (2026-06-25 to 2026-07-17) is archived separately, not mixed in.
The backtest figures come from the same past data we used to refine the strategy, so expect less than the backtest: plan on a high-teens yearly return at 2× exposure, not 26%. The one clean test so far is the first half of 2026, on unseen data with the rules locked in advance: +12.8% with no leverage and a Sharpe ratio of 1.73. Judge the strategy by the live record as it builds. Nothing here is financial advice.
The public record is 100% paper trading, meaning simulated trades. Separately, we follow the same rules with our own money. Those personal results are private and are not part of the published track record.
Trading for 5 years. Builds and tests new trading strategies and algorithms; runs Mereckis Labs and its transparency-first publishing.
Five years of systematic trading. Built this algorithm and the validation pipeline behind it, along with many strategies that failed testing and were cut.
Get the live positions, the signal feed, and the full transparent track record.
What a membership actually looks like: signals are updated after the market closes. Typically there are 0–2 orders a day across the 8 sleeves, placed as limit orders before the next market open, and some days none. Expect about 10 minutes a day in any brokerage. On cost, $97 a month works out to roughly 1.2% a year on a $100k account but about 12% a year on $10k, and that comes straight out of your returns. If your account is small, the math may not work for you yet.
Refunds: full money-back within 7 days of your first monthly payment or within 14 days of an annual payment, no questions asked. Renewal payments are not refundable, but you can cancel at any time and keep access through the period you paid for. Request it from your Whop purchases page (Whop handles our payments) and it returns to your original payment method.
No. This is a paper test, meaning the trades are simulated. It is recalculated every day on real closing prices, and the version 7 record has been building since 2026-07-10. No live orders are placed. (The team separately trades the same rules with their own money. Those results are not the published record.)
Overfit means tuned so tightly to past data that it stops working on new data. We assume it is until a test says otherwise. Versions v1 through v7 each had to beat the previous one on pass-or-fail tests set in advance, and small changes to each setting had to leave the results intact. 40+ rejected ideas are documented in our research registry. The strongest evidence so far is a true out-of-sample test: with its rules locked in advance, the model earned +12.8% with no leverage (Sharpe ratio 1.73) in the first half of 2026, on data it had never seen.
Crash behavior. In the rare months when volatility spikes, the guard moves the reserve into a defensive basket with a 30% position that gains when the market falls and halves exposure, so the worst months are exactly what it is built for: a 2008-style stress test loses −22.3% and the 2020 COVID crash loses −6.8%. In calm rising markets it is not built to beat the index (the overall market); its edge is what happens in the crash months.
The backtest says 26% a year (CAGR) at 2× exposure in calm months over 2010–2025. Treat that as an optimistic ceiling: it only counts the strategy versions that survived our testing, and we plan on a high-teens yearly return in live trading. For risk, budget around the −22.3% loss from the 2008 stress test rather than the milder worst decline in the backtest.
Two reasons. Subscription revenue funds the research. Publishing a paper record in public, before the results are impressive, is the strongest discipline we have against fooling ourselves. A private track record convinces nobody, including us.
Members get the current positions, the daily signal feed (what the rules say to buy or sell), and the full dashboard. The signals are simple enough to place by hand in any brokerage account. Nothing here is financial advice; you trade your own account.
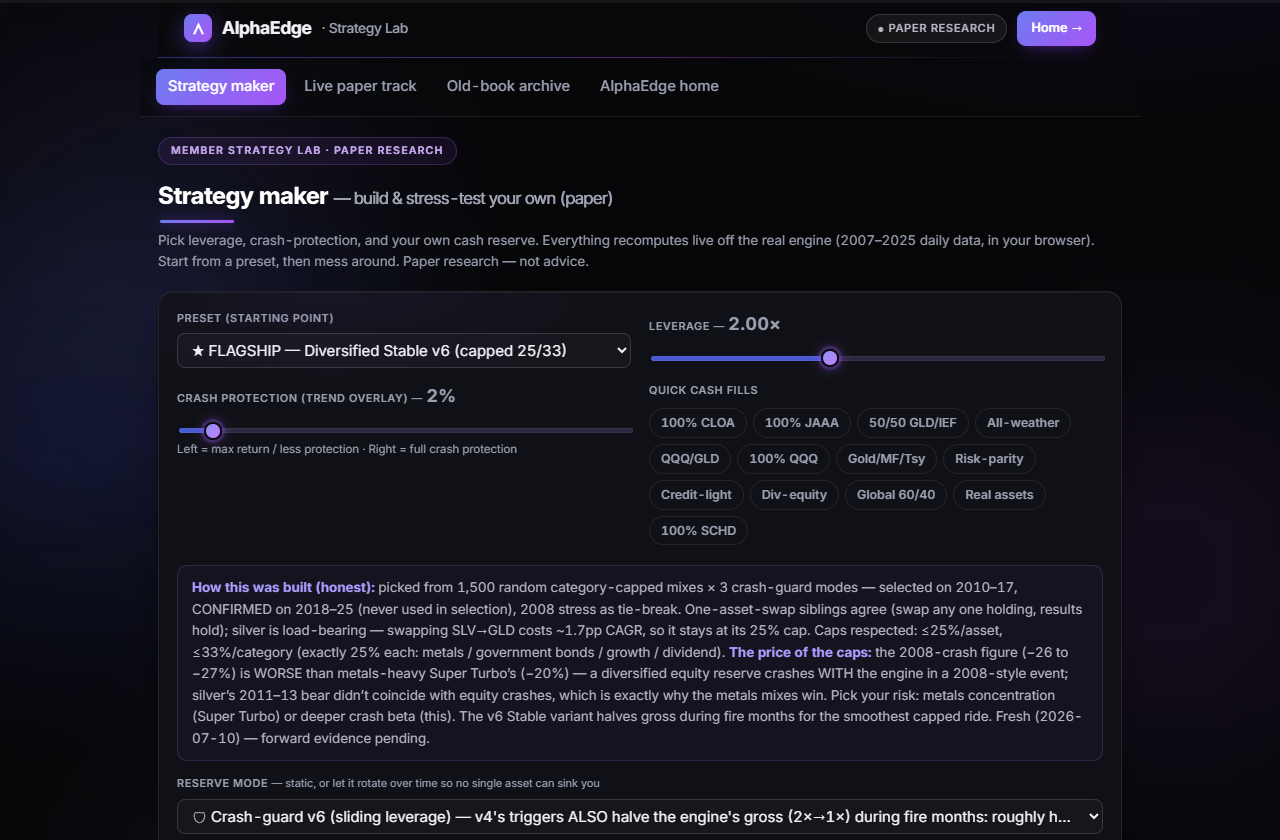
Everything on this page comes from the member lab: the interactive strategy explorer, every version and setting with its caveats, the current target allocation (how the portfolio should be split right now), and the daily signal feed. Nothing is held back once you're in.
That's the real thing, not a mockup. Open the live preview →